When your SQL Server database starts experiencing performance issues, it’s crucial to have tools at your disposal to quickly diagnose and address the root causes. One such tool is a performance troubleshooting script that provides insights into SQL Server’s current state, including worker threads, running queries, and various performance metrics. In this blog post, we’ll walk you through a handy script that can help you identify and tackle performance bottlenecks efficiently.
Performance Troubleshooting Scripts
1. Get SQL Worker Threads
This section of the script retrieves the current count of SQL worker threads, providing visibility into the server’s workload and resource utilization.
-- Get SQL worker threads
SELECT SUM(current_workers_count) as [Current Worker Threads] FROM sys.dm_os_schedulers
In an unhealthy scenario, thread starvation may occur, leading to increased wait times and degraded performance. From my experience, if threads are above 500 I may be looking at recompiling SP’s and reviewing all SPIDs.
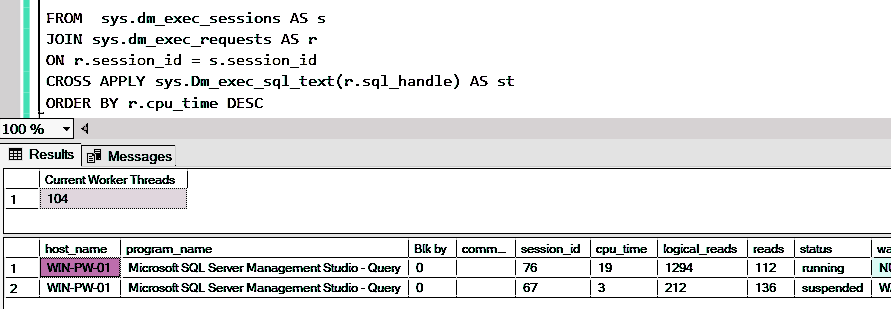
2. Show Running Queries
Here, the script displays information about the queries currently running on the SQL Server instance, including details such as host name, program name, session ID, CPU time, wait types, and more. This insight into active queries can help pinpoint performance-intensive operations.
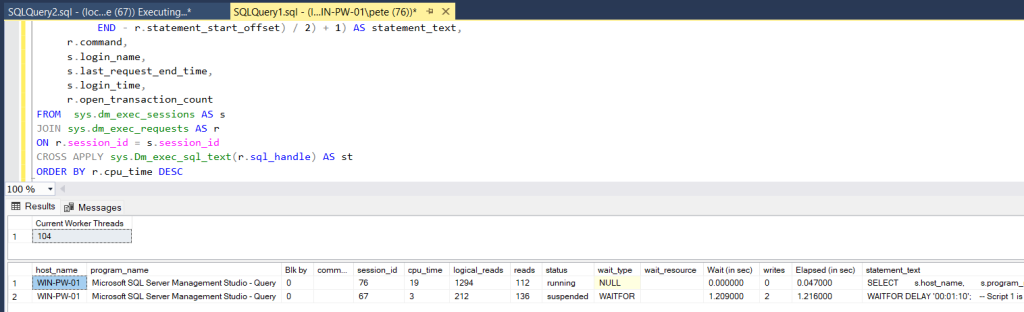
If the script to show running queries returns a large number of rows, indicating a high level of activity, it suggests that the server is busy processing numerous concurrent queries, potentially leading to resource saturation and system instability. Administrators must monitor worker thread counts and query activity closely, interpreting results effectively to proactively address performance issues and ensure optimal database operation.
Notes for Optimization
While the provided script offers valuable insights into SQL Server performance, additional steps can be taken to optimize performance further. Here are some suggestions:
- Optimize/Recompile Stored Procedures: Use
sp_recompileto recompile stored procedures periodically, ensuring optimal execution plans. - Kill SPIDs: Identify and terminate long-running or problematic sessions using the
KILLcommand. - Check for Blocking: Monitor and resolve blocking issues to improve concurrency and responsiveness.
- Reindexing/Updating Statistics: Regularly maintain indexes and update statistics to ensure efficient query execution. This includes adding new indexes where required.
By incorporating these optimization strategies alongside the provided troubleshooting script, you can enhance the overall performance and stability of your SQL Server environment.
With this performance troubleshooting script and optimization tips in your arsenal, you’ll be better equipped to tackle SQL Server performance issues head-on, ensuring smooth operation and optimal efficiency for your databases.
2 thoughts on “Quick Performance Troubleshooting Script for SQL Server”