As a SQL Server Database Administrator, troubleshooting query performance issues might unfortunately be a common task. Pinpointing the most frequently executed queries is akin to peering into the heartbeat of your system. Understanding which queries are running most often not only shows us the workload patterns in SQL but also gives us the information we need to guide us in performance optimization and troubleshooting a specific query or procedure.
As described, in this blog post we’ll share a SQL Server scripts that will help you show the most frequently executed queries on a database.
SQL Script: Get Most Frequently Executed Queries
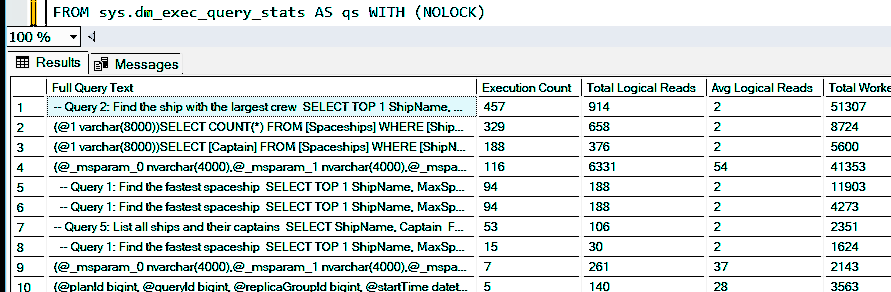
Running this script will return a list of the top 50 queries that are hogging the execution spotlight within your SQL Server database:
-- Get most frequently executed queries for this database
SELECT TOP(50)
    LEFT(qt.[text], 1000) AS [Full Query Text], -- Increased length for full query text
    qs.execution_count AS [Execution Count],
    qs.total_logical_reads AS [Total Logical Reads],
    qs.total_logical_reads / NULLIF(qs.execution_count, 0) AS [Avg Logical Reads],
    qs.total_worker_time AS [Total Worker Time],
    qs.total_worker_time / NULLIF(qs.execution_count, 0) AS [Avg Worker Time],
    qs.total_elapsed_time AS [Total Elapsed Time],
    qs.total_elapsed_time / NULLIF(qs.execution_count, 0) AS [Avg Elapsed Time],
    CASE
        WHEN CONVERT(nvarchar(max), qp.query_plan) COLLATE Latin1_General_BIN2 LIKE N'%<MissingIndexes>%' THEN 1
        ELSE 0
    END AS [Has Missing Index],
    qs.creation_time AS [Creation Time]
FROM sys.dm_exec_query_stats AS qs WITH (NOLOCK)
CROSS APPLY sys.dm_exec_sql_text(qs.plan_handle) AS qt
CROSS APPLY sys.dm_exec_query_plan(qs.plan_handle) AS qp
WHERE qt.dbid = DB_ID() -- Changed to use alias
ORDER BY qs.execution_count DESC OPTION (RECOMPILE);

Script Breakdown:
– Full Query Text: Provides SQL query command text for easy identification.
– Execution Count: Reflects the number of times the query has been executed since its compilation.
– Total Logical Reads: Indicates the total number of logical reads performed by the query.
– Avg Logical Reads: Shows the average number of logical reads per execution, offering insights into query efficiency.
– Total Worker Time: Measures the total CPU time consumed by the query.
– Avg Worker Time: Shows the average CPU time per execution, aiding in identifying resource-intensive queries.
– Total Elapsed Time: Represents the total duration spent executing the query.
– Avg Elapsed Time: Highlights the average execution time per query, crucial for performance analysis.
– Has Missing Index: Flags whether the query execution plan suggests missing indexes, signaling potential optimization opportunities.
– Creation Time: Indicates the timestamp of the query plan creation, aiding in historical analysis.
Conclusion
Database Administrators and Developers can prioritize optimization efforts, focusing on queries with high execution counts or resource consumption. Additionally, identifying queries lacking adequate indexes can lead to targeted index optimization, further enhancing performance.
For more in-depth performance tuning strategies and SQL Server optimization tips, check out my SQL DBA Cheat Sheet, and stay tuned for more tips to maximize your database’s efficiency and performance!
One thought on “Get Most Frequently Executed Queries in SQL Server”